Marketing Analytics is one of the efficient ways you can use to track the outcomes of your existing marketing strategies. To better understand how your marketing channel is performing, your marketers need to examine their digital marketing strategies.
In doing so, you’ll discover new opportunities for connecting and engaging your target audiences. Additionally, running a digital marketing analysis helps you develop a strong marketing analytics strategy. Plus, you can even use this process to structure your business goals around the outcomes.
To get started with digital analytics, let’s start by defining what’s discussed below
Digital Marketing Analytics: What Is It?
Digital Analytics is the translation of behavior into actionable data. It is the process of analyzing collective data from online sources such as Facebook, websites, and mobile apps. Digital Marketing Analytics allows you to see the activities in your business, such as how many users visit your site and how long they use it for and other information.
1. Digital Metrics for Websites
Digital marketing parameters for website include;
New and returning visitors
These are people who visit and use your site. There is a cookie placed in the visitors’ browser to track their activities. New visitors are those who are using your site for the first time while returning visitors are those who’ve used your site previously.
Sessions
Sessions are the actions taken by a visitor on your sites, such as C.T.A. and events. These metrics allow you to understand whether your site is gaining popularity by comparing the metrics from different times.
Web traffic
Web traffic is the number of site visits at a given time. It also tracks the sources driving this traffic to your site, such as referrals, direct and organic searches.
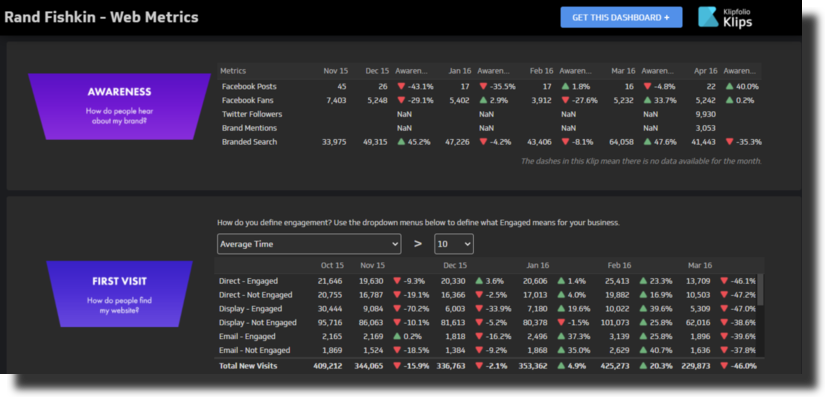
Average session duration
This shows you how visitors are engaging with your site. You can calculate it by dividing the total duration for all the sessions by the number of sessions. If the duration is short, your site may not be that engaging visitors or it’s attracting the wrong clients.
Online conversion rate
Conversion rates are the number of sessions on your website from which a visitor takes a particular action, such as subscribing and signing up as a member. These sessions are converted into percentages. It lets you weigh the effectiveness of your marketing strategies.
Bounce rate
It’s the opposite of conversion rates. This is the percentage of users who visit your site but don’t take any actions, for instance, viewing another page.
Traffic by channel
These tracks visit your site from different channels such as email and social media.
Traffic by device
It is the number of visits from different devices such as Smartphones, desktops, and others.
Interactions per visit
This is the number of factions taken by visitors while on your site.
2. Digital Parameters for Lead Magnets
Digital parameters for lead magnets include;
Call-to-Action (C.T.A.) click-through rate
C.T.A is the percentage of clicks on a C.T.A. compared to the total number of site visits.
Conversion rate
Conversion rate is the total number of actions taken, such as sign-up and subscribing on lead magnets, compared to your site’s total visitors.
Free trial conversion rate
If you offer free trials, this rate calculates the percentage of free trial users converted into customers after their trial period is over.
Submissions
It’s the percentage number of people who fill out and submit forms on your site.
Pop-up conversions
It is the percentage number of pop-up form completions who convert into customers.
The ratio of generated leads to marketing-qualified leads (M.Q.L.)
In Marketing Analytics, this is the number of leads from lead magnets compared to the number of generated leads.
Leads to close ratio
A lead to Close Ratio is the percentage of leads covered into customers compared to the total leads.
3. Digital Metrics for Email Marketing
Digital Metrics for Email marketing includes;
Open Rate
This is the number of opened emails compared to the total number of sent emails.
Open rate by device
The opened emails are classified according to the device used, such as tablets or smartphones.
Click-through rate
This is the total number of click-on links and C.T.A. sent in the emails compared to the total number of emails opened.
Bounce rate
Bounce Rate is a percentage of the undelivered emails compared to the total number of sent emails.
Unsubscribe rate
The rate at which people unsubscribe from your email list at a certain period is expressed as a percentage.
4. Digital Metrics for Content and Social Media
Digital marketing metrics for content and social media include;
Engagement rate
The total number of engagements such as likes and comments compared to the total number of post views.
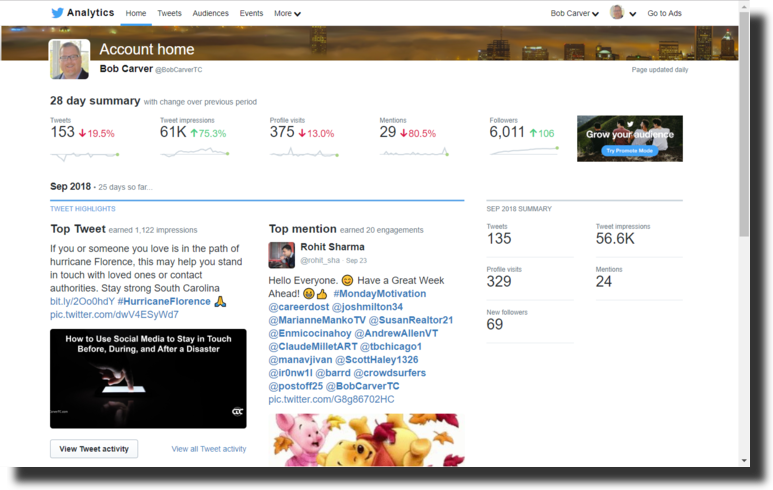
Follows and subscribes
It’s the total number of people who subscribe or follow your social media platforms.
Shares
It is the number of times a post is shared on social media, blog, or website.
5. Digital Metrics for Product and E-Commerce
Digital Metrics for product and e-Commerce services
Shopping cart abandonment rate
The total number of online shoppers who ‘add to cart’ your products but don’t complete the purchase compared to the number of people who make a complete purchase.
Marketing Analytics Tools
#1. Traffic Based Tool
- Google analytic
Google Analytics is a free and widely used tool for Marketing Analytics. It allows you to track traffic on your site. With this tool, you can track down where your visitors are coming from and how much time they spend on your site.

However, this tool is quite complex when it comes to tracking new leads. It also lacks the capability to track individual users to understand what they are looking for in your site.
Who is it for?
This tool is ideal for a marketer who wants to keep track of traffic on their site. It is not a good tool for a marketer who deals with sales, conversions, growth, and events, as it does not have such capacity.
Pricing
As a basic version from Google, this tool is free. For advanced options, there is a premium version ideal for enterprises. This version costs about $ 100k per year. It offers in-depth data analysis with ample support from Google.
- Matomo
It is an open-source tool formerly known as Piwik and works similarly to Google Analytics. Matomo monitors traffic on your site and lets you customize reports for data segmentation through the user’s geolocation, operating system, traffic source, and browsers. It also enables you to create reports on how visitors used your site.
This free tool has many features, such as page overlay analytics, custom variables, and campaign success.
There is a premium version of Piwik Pro that offers a self-hosting analytics suite. This version targets governments and large enterprises that require complete data ownership and privacy compliance.
Who is it for?
This tool is ideal for small businesses, governments, and enterprises.
Pricing
Matomo is a free open source
#2. Market Dashboard Tools
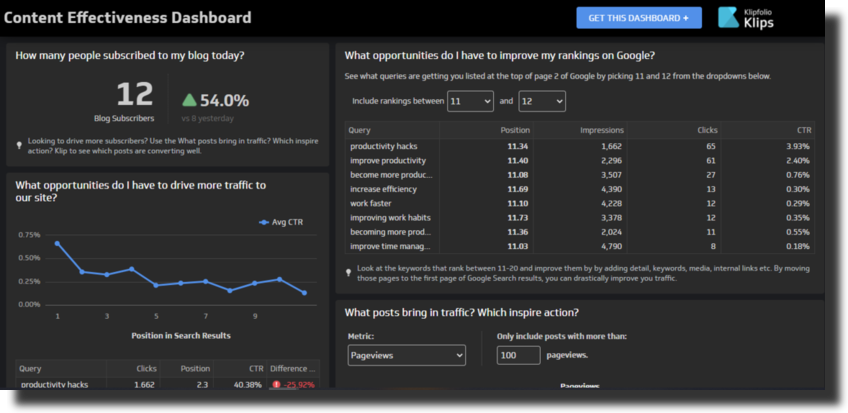
- Klipfolio
Klipfolio is market dashboard software that lets you create your desired dashboard containing your market data from different channels. You can include data from tools such as Facebook and Google Analytics. It allows you to trace the performance and integrated data in a single dashboard.
There are pre-built templates that save you the trouble of having to build dashboards for monitoring Facebook ads. However, if you wish to create your dashboard, you can do so according to your needs and preferences.
Who is it for?
It’s perfect for a marketer who has to monitor data from different channels all on one screen. It is also can help a digital marketing agency that wishes to create dashboards to share with its clients.
Pricing
There are different pricing levels for Klipfolio; one starts at $24 per month, this is for a team of few users. The second one costs $ 199 per month for several users who want to share different dashboards
- Cyfe
Cyfe is an all-in-one tool that lets marketers integrate the data across different tools and monitor it from one place. The marketers can track data from sales platforms, social media platforms, and pay-per-click channels, among others.
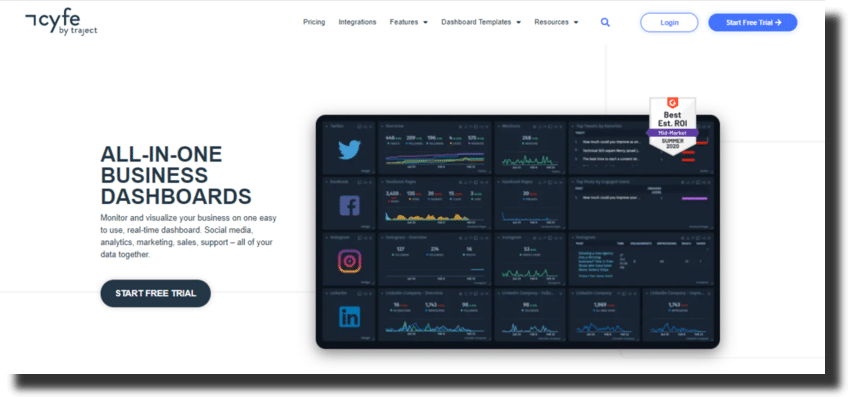
Cyfe collects data from all these tools and channels and displays them on one dashboard.
Who is it for?
This tool is useful for marketers who wish to collect data from multiple channels and view them from one place.
Pricing
Life is a free tool, but it has a premium version that goes for $ 19 per month. The premium version gives one access to unlimited exporting reports, historical data, widgets, dashboards, and others.
#3. Event Oriented tools
- Heap analytics
Heap Analytics automatically tracks all actions taken on a site by visitors. It also lets you pick the events you want to analyze.
As a new tool, it lets you track individual user behavior and categorize users according to their behavior patterns. It collects data and allows you to review each retroactively from the first date to the current one.
Who is it for?
Heap is a good tool for marketers dealing with different events and who wish to classify this data and conversion from their sites.
It may not be a good tool for a marketer who deals with Android application marketing as the tool is yet to support Android apps.
Pricing
The pricing plan for Heap is quite flexible and depends on the feature and volumes one is using. It starts with a free version which does not offer as many abilities as one would wish. For a premium version, custom pricing is given by Heap.
- Oribi
This tool is specially made to help marketers make faster but smarter data-driven decisions. Oribi has a simple user interface and does not require that you create reports and analysis as it has result-focused features.

It makes data collection easy by automatically collecting all data from website events and conversions. If there are any changes on your site, such as trends, Oribi will track and highlight them as new events.
Who is it for?
Oribi is made for marketers focused on achieving better results through Digital Market Analytics without analysts’ and web developers’ help.
Pricing
Oribi offers a cheap plan of $ 79 per month inclusive of all features. The yearly plan stands at $ 799.
- MixPanel
MixPanel tracks events on your site, app, and products. It monitors all the actions taken by users on your site or app (it supports Android and iOS). Once you add the events you wish to track; you will see the trends, counts, and users.
It has different features such as funnels, tracking of individual user actions through sessions, A/B testing of different variations on mobile applications, and results tracking, monitoring even trends, among other features.
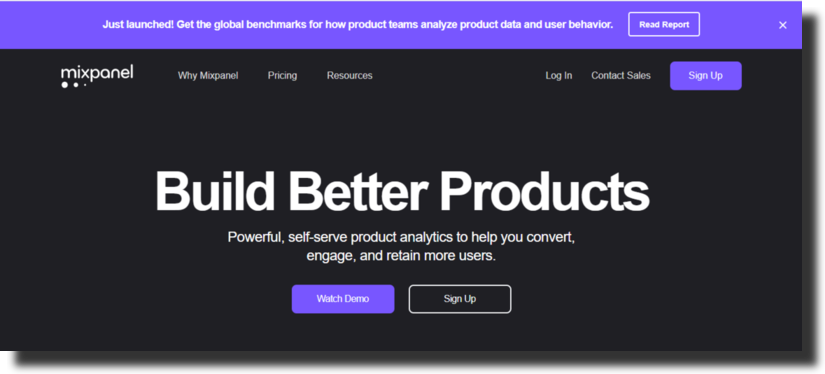
For better tracking, with MixPanel, you must first enter and define the actions you intend to track. To do this, you can simply add a code annotation or use a visual selector. From there, the events will be added to your dashboard together with the metrics.
Who is it for?
This tool is perfect for product managers who need product-oriented tools. It’s also made for marketing teams that are focused on funnel optimization and user behavior.
Pricing
There are several pricing levels for MixPanel; these levels are set depending on the number of events tracked. There is a basic version that goes for $99 per month.
However, since it’s even-based, it might cost a little more depending on the company size and the number of events tracked. It discourages small and medium-sized businesses from collecting optimal data for their Marketing Analytics as they may end up paying more. As a result, these companies might not track their events and miss important information.
- KissMetrics
KissMetrics is a behavioral analytics-designed tool. It is intended to access information on customers and their actions on your site or individual product.
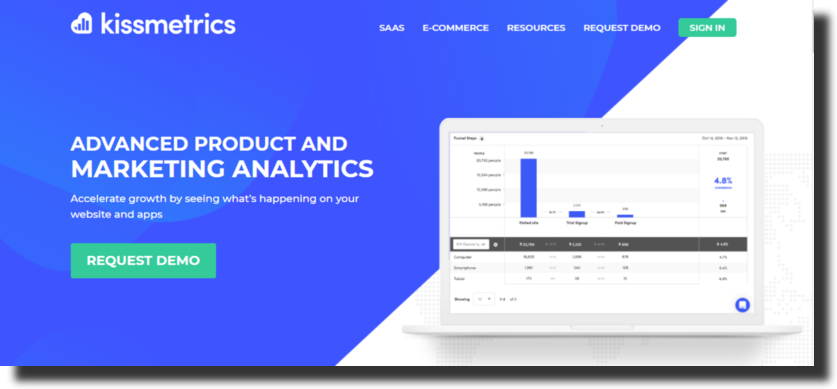
It is helpful as it helps the marketer increase the user’s agreement and improve their pages’ conversion rate by understanding how customers interact with the products.
There are also features for A/B testing to understand how changes made on a site or product affect the overall results. This way, one has the advantage of making the right changes for optimal results.
Who is it for?
KissMetrics will be helpful for marketers whose goal is to understand their users by building effective dashboards.
The data generated by this tool can be effective in increasing conversions to get better customer engagement for improved marketing results.
Pricing
Since it is an even-based tool, its pricing is dependent on the number of events stacked, the features one uses, and the amount of support one gets from KissMetrics. The pricing ranges from $ 220-$1,400 and may go up if one tracks over 10M events.
#4. Search Engine Tools
- Google Search Console
Google Search Console allows you to analyze organic search traffic from search engines. It works like a keyword research tool showing you the terms that direct users to your site from Google.
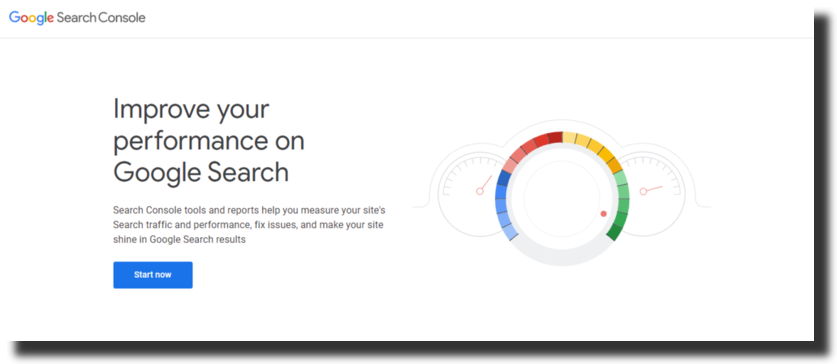
With the clicks, you can also view the number of impressions per search term and its C.T.R. Also, you can view your site’s ranking in search engines through the terms.
Who is it for?
Google Search Console helps marketers to drive more traffic to their site from paid or organic search engines. By knowing which terms drive more traffic, you can use them to extend their S.E.M. efforts and search traffic around keywords.
It is also a good tool for someone who wishes to grow through Content Marketing Analytics.
Pricing
The Google Search Console is a free tool.
- SEMrush
SEMrush is one of the Marketing Analytics Tools that lets you keep track of your competitors. By knowing what your competitors are doing, you can use such information to stand out in the market. You can also use the tool to track and monitor your brand.

One of SEMrush’s features is that it displays data segmented from the keywords your competitors use in their ads. This lets you know the search engine traffic. It enables you to analyze the keywords and assess whether other competitors in the dame rank use them.
Who is it for?
SEMrush is for marketers who want to increase their traffic and monitor their competitors. With SEMrush, you can improve the effectiveness and efficiency of your search engine strategies.
Pricing
There are three payment plans for SEMrush; the basic version has limited features and goes for $99 per month, while the premium version goes for $399 per month and comes with all the available features.
How to Use Digital Marketing Analytics Effectively
Marketing Analytics involves more than just monitoring traffic. The above tools offer an excellent opportunity to make the most out of them. However, most marketers are still struggling on this end.
Some of the reasons for these challenges could be attributed to a lack of concrete goals and proper means of measuring your success level. Fortunately, below are some approaches you can use to get the most from your digital marketing analytics.
1. S.M.A.R.T. Goals
With the right business goals, you can combine your priorities with those of your team. Try using the S.M.A.R.T. format, which generally stands for;
- Smart
- Measurable
- Attainable
- Relevant
- Timely
With such goals, one can organize the productions of customer-based metrics and easily measure their progress. If you are working with a marketing team, you can categorize this into three;
- Web traffic and diversity of sources
- Production of leads and customers from traffic generated conversions
- Identifying marketing efforts that result in new net revenue and improving these efforts for further growth
Marketers must balance the performances of different digital analytics platforms to gain insights and make better business-oriented goals.
The main challenge comes in viewing information through a fragmented approach. Connecting the dots with such makes it even harder to make informed decisions. There is hence the need for an all-in-one marketing approach that locks in reporting and offers marketing insights. This way, you can quickly gauge the productivity of everything on one platform.
2. Campaign-based reporting
With campaign-based reporting, you can contrast data charts showing an entire marketing campaign’s progress or just content-wise.
With these custom reporting capabilities, you can view the origin and destinations of your potential buyers. You can easily configure Digital Marketing Analytics with a tool such as HubSpot’s Marketing Hub, with it or with a similar tool; you can view different analytics such as;
3. Contacts funnel report
It is a calculation of conversion rates from the sales and marketing funnels. It shows leads that run into marketing qualified leads, converting into qualified sales leads, and finally into new customers.
4. Marketing contribution to revenue
Such a report depends on how you use your marketing qualified leads, the lifecycle stages, analyzing the leads that convert into customers to gauge the revenue generated from them entirely.
5. Web Traffic by the original source
Such reports are configured by date range or source of origin. This way, you can clearly understand the challenges you need to capitalize on to drive more traffic and convert visitors into customers.
6. Conversion by the original source
This report lets you weigh the number of new contacts you acquire based on the forms submitted from your sites or products; it then links these contacts to their original sources.
7. Customer acquisition cost
They are closed-loop reports that let one depict their progress from a business’s bottom line. They calculate the amount of money spent by a marketer to attract, engage and maintain a buyer.
Why Should you Consider Marketing Analytics For Your Business
Through measuring and analyzing your marketing performance, you can drive more traffic and increase conversion rates. It gives you insights to accelerate the performance of your marketing strategies in various ways. These include;
Making better decisions
Marketing tools help you to make sense of multiple data gathered from different channels. These tools connect the dots for better decision-making.
Improve existing marketing strategies
Based on the information generated from your digital marketing analytics, your marketers will spot deficiencies in each channel used in the marketing mix. Thus, they can make adjustments to the used strategies and approaches to enhance the overall online marketing activities.
Predict customer lifetime value
When combined with sales data, Marketing Analytics allows you to predict customer lifetime value. It helps you as a marketer to optimize your spending into effective initiatives such as customer retention and services for enhanced customer lifetime value.
Optimizing workflows
Since marketing involves running and managing different events and campaigns, they need to know what is happening and when. Marketing Analytics Tools have various features such as alerts that allow you to keep a tab of all campaigns and events from one screen; it makes marketing work easier.
Grow Your Business Better with Digital Marketing Analytics
Finally, data and information collected for analytics from the different tools are only helpful provided you put it into good use. Realize that proper marketing delivers results, not just well-calculated data.
This way, you’ll identify areas that are performing well and those that aren’t. From this information, you can then take affirmative business actions to get more revenue.
As you search for the right digital analytics tool for your business, it’s crucial that you look for digital marketing analytics evidence in addition to web analytics.
Realize that although web analytics will give you a great overall picture of your top-performing activities, digital marketing analytics goes beyond that. It helps you turn your company’s goals into measurable results that enhance your bottom line.
By prioritizing data that signifies people and not page views, you’ll help grow your business in no time.
Marketing Analytics is broad, and the details mentioned above are only the basics to help one kick-start this journey. As for which tool is the best, it’s only up to you to make that choice.
Marketing Analytics FAQs
What Is Marketing Analytics?
Marketing analysis involves breaking down your marketing processes into measurable items that are easy to interpret, manage, and evaluate the success of your specific marketing efforts. You can use marketing software to better assign various results for specific marketing touchpoints and actions.
Which social media channels should I use?
First consider the best social channels in regards to active users: Instagram, Facebook, Twitter, Pinterest, and LinkedIn. Establish where your audiences spend their time. Explore the behavioral patterns and demographics of users. Additionally, consider the kind of content you share
How long will it take before I see the results?
With paid marketing programs you should see results immediately. However, programs like email list building, search engine optimization, and content marketing do require patience and persistence. You might notice some results after some months but, it might take 6 months to one year before you reach some of your set conversion and traffic goals.
Why do I need Google analytics?
When used properly, Google Analytics will help you monitor all the multi-channel digital marketing activities, and that includes some offline. By understanding and taking action on the information gathered, you’ll be able to increase your website’s visibility. You’ll also be able to improve your online presence thus drive more revenue


