With most infographic creation tools, you do not need to have design skills to create visuals. Infographics help summarize long-form content and plain numbers to make it easy for the intended audience to understand.
Human beings are attracted to visuals. In fact, 67% of marketers in B2B are using infographics for marketing. They help to capture the attention of the target audience.
With most of the online infographic creation tools, creating designs is easy and fast. Do you want to find out more about these tools? Let’s have a look at a number of them below.
But first, let’s find out what an infographic is and the benefits of using them.
Let’s get started!
What Is An Infographics
An infographic is a form of visual that marketers use to communicate information. It captures the most basic information. Tips to create quality graphics are using images, colors, and different fonts.
Infographics apply to all types of businesses. To make them more attractive, and increase engagement, consider using bold text. You can work with a graphic designer or digital marketing agency to help you design infographics.
Types of Infographics
For a beginner, you need to know the various types of infographics. People use infographics for different reasons. To effectively implement them in your business, have the following information in mind.
Statistical infographics
With statistical infographics, they represent numbers, charts, data, facts, and research. The purpose of using this type of infographic is to help communicate numbers and tables.
For instance, in data visualization, the analyst will use charts, bars, and tables to represent data from a spreadsheet.
Instead of having plain numbers, a statistical infographic simplifies the figures in a presentable manner that is easy to digest. Statistical infographics are more of numbers than text.
Informational Infographics
Compared to statistical, informational infographics have more text. The infographics summarize information and make use of images, text, fonts, logos, and colors.
They help to drive organic search traffic and communicate important ideas to the audience.
Process infographics
You can also refer to process infographics as flow charts or decision trees. Each step in the infographic is linked to the other using an arrow.
Process infographics help in explaining a concept from the start to the conclusion. For instance, you can use it to describe an audit process or coding process.
Timeline infographic
Timeline infographics are suitable for representing data in chronological order. For instance, you can use it to represent the history or evolution of something.
Besides, you can also use the timeline infographic when creating a project timeline and presentations. The infographic contains images, logos, text, dates, and colors.
Comparison Infographics
As the name suggests, a comparison is about comparing different elements. This type of infographic helps to show the differences and similarities of products, services, ideas, etc.
For instance, you can use this infographic to show the difference between Woocommerce vs Shopify or Shopify vs Squarespace.
A comparison infographic gives you room to test your creativity and represent data in a manner that is simple to understand.
Benefits Of Infographic Creation
Have you thought about using infographics, but you’re reluctant about implementing them? In marketing, infographics play a crucial role. You can use them to attract, engage, and convert leads.
Not only can you use them for marketing but also on websites. Some of the main benefits of using infographics are:
1. Help to beat the competition
Infographics are a form of marketing that you can use to beat your competition. Infographics help to create awareness and communicate relevant information fast.
In addition, they help to build credibility as they include a logo, contact information, images, and text.
2. Easy to absorb information
With an infographic, it is easier for the audience to understand information. Instead of reading long texts or figuring out plain numbers, an infographic helps in summarizing the data. Also, it is easier for the audience to remember content from an infographic.
3. Infographics help to boost SEO.
As earlier mentioned, infographics help to communicate information. Infographics attract new customers to your webpage, blog, or social media pages.
The more people click on your site, it helps to boost organic traffic on search engines. You can also add keywords to accompany texts in the infographic.
4. Infographics are easy to share
Another benefit of using infographics is that they are easy to share. If your audience finds your infographic valuable, they are likely to share it on other platforms as well.
5. Infographics help to boost sales.
Are you looking for legit ways to increase online sales? With the above types of infographics in mind, you can implement one that works for you.
For instance, a web design agency can use a timeline infographic to explain how it will achieve a website task for a client.
With such an infographic, clients are likely to build trust and refer a brand to other interested customers.
15 Best Infographic Creation Tools in 2021
Are you looking for tools to use to create infographics? Are you looking for an infographics creation service? We have everything you need to know to design engaging infographics.
With so many infographic creation sites online, you do not require design skills to design visuals. What you need are a logo, text, and colors to use.
Let’s dive in!
1. Venngage
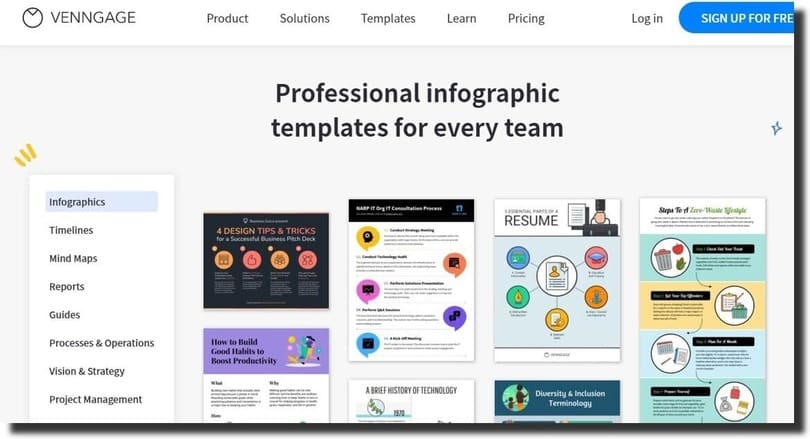
Venngage is an online infographic creation tool that helps you visualize data. With it, you can design infographics from scratch or use the available free and premium templates.
It comes with various pricing plans ranging from free to enterprise. Venngage is easy to use and does not require you to have graphic design skills. The infographic creation tool is applicable for marketing, human resource executive leadership, training, and development.
2. Canva
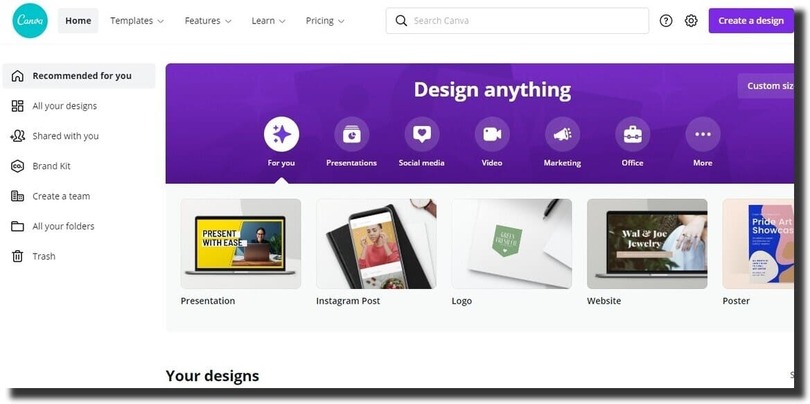
Canva is one of the free infographic creation sites that allows you to create different visuals. To design an infographic, select a template before you proceed to customize it.
For advanced features and use, Canva has a premium pricing plan. As a feature of the tool, it allows you to create teams to collaborate with members on a design.
Canva for nonprofits gives the nonprofit organizations free access to premium features. In addition, it has over 75 million images and videos accessible by organizations for creating high-quality visuals.
3. Piktochart
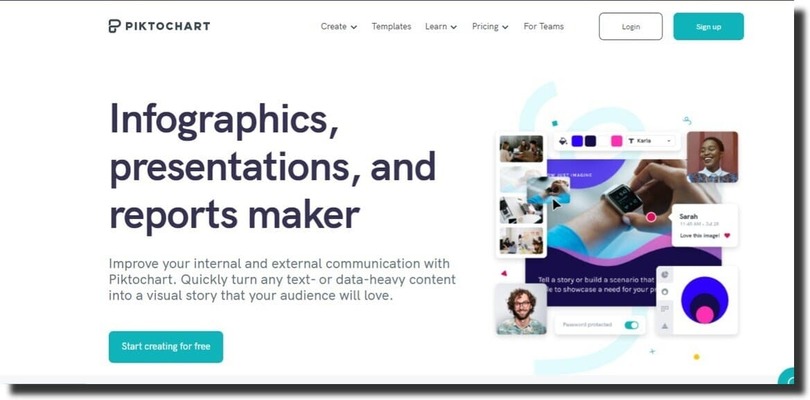
Piktochart is free to use, and it comes with different pricing. Besides infographics, the tool allows you to design visuals for presentations, social media, reports, and flyers.
For non-designers, select a template to use and customize it to meet your brand’s theme. The benefit of using a template is the drag & drop feature.
The types of infographics you can design with Piktochart are comparison, process, and timeline. The tool also integrates with Google Sheets and Excel to create visuals from complex data.
4. Visme
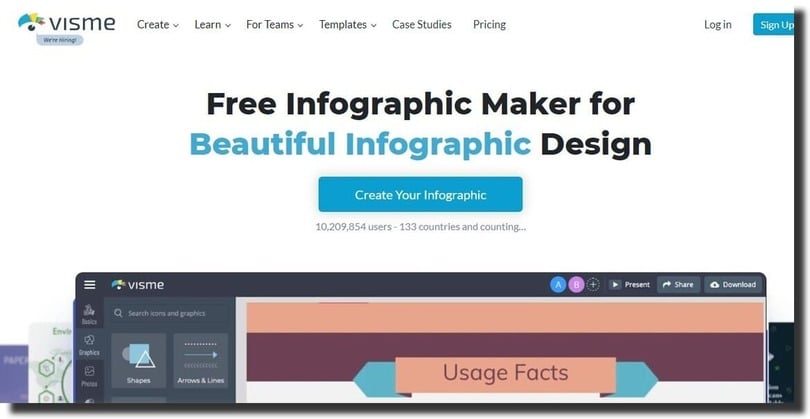
The benefit of using online tools to create infographics is the wide selection of templates. Visme, an infographic creation tool, helps you to design visuals within minutes.
To save time when creating designs, select a template and edit it using the drag & drop feature. Visme allows you to include animations in your Infographics.
In addition, you can also add maps, forms, and videos. Visme makes it possible to track and analyze the performance of the infographics. It also allows you to collaborate with teams, set guidelines, and decide who can view and share your infographics.
5. Infogram
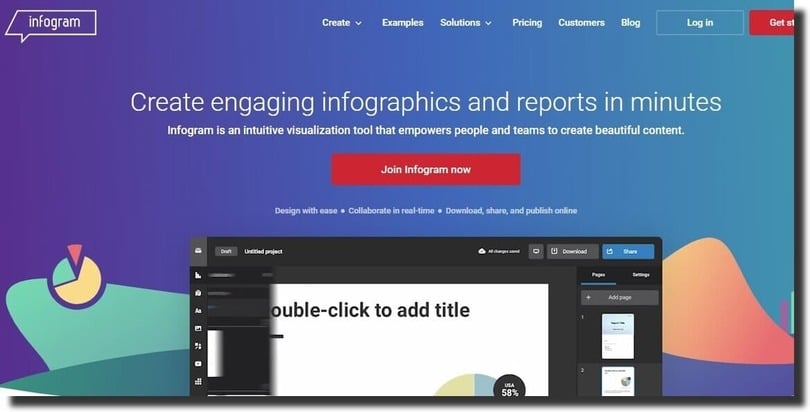
With Infogram, be sure to create beautiful, responsive visual content for your target audience. The tool helps you collaborate with a team in real-time, share, download, and publish visuals online.
Besides infographics, Infogram allows you to create designs for YouTube thumbnails, social media posts, reports, email headers, and more.
As for the pricing, Infogram has a free plan as well as premium plans. Additionally, the tool offers special prices for startups, nonprofits, and educational organizations.
6. Easelly
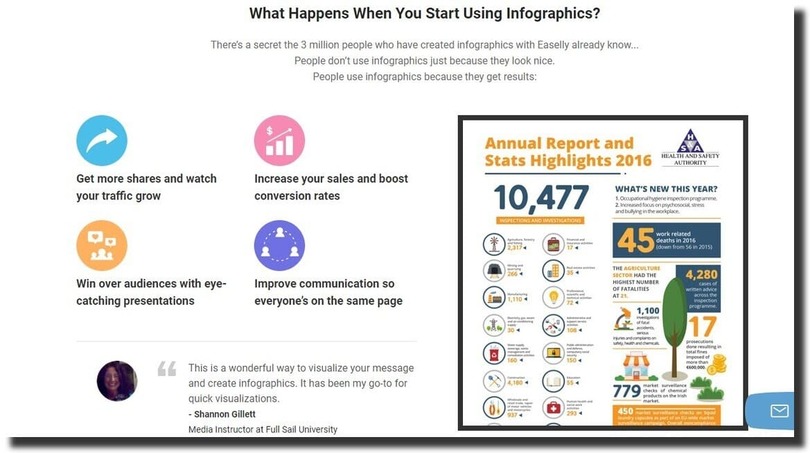
The easiest way to convert plain data into visual content is by using an infographic creation tool. Easelly allows you to create and download infographics for free.
Similar to other tools, it has hundreds of templates to choose from. In addition, the drag & drop feature makes it easier to customize templates.
Once you upgrade to a premium account, Easelly gives you access to 20 different charts. It also allows you to use images, icons, and illustrations for free.
After designing the infographic, the available formats to save are pdf, JPEG, and PNG. Also, you can share the visuals using email, social media, embedded codes, or links.
After completing a design, Easelly allows you to invite other members of your team to edit.
7. Biteable
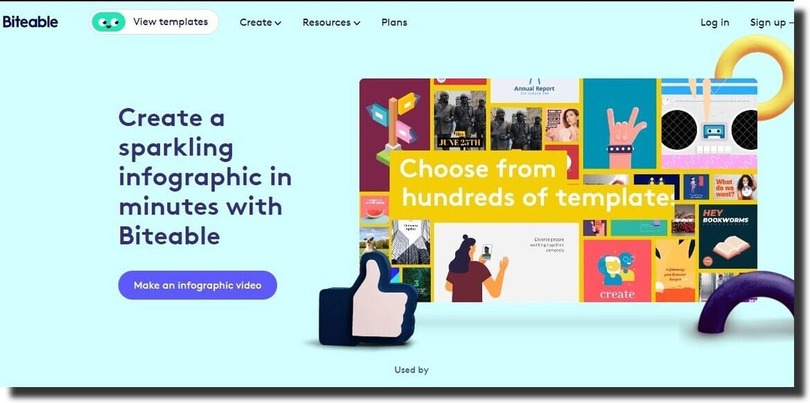
Making an infographic video with Biteable is very easy. You can create your design from scratch or by using a template. Choose from a library of live actions and animations to use in your video infographic.
With Biteable, you do not need a learning curve. Video and images have a higher engagement rate compared to text-based content. Some of the videos to make with this tool are for marketing and real estate.
The video infographics have a balance between both text and video clips. Available pricing plans are free, plus, and ultimate.
Premium users can download and store infographic videos on the Biteable profile, while free users can only publish on Facebook and Youtube platforms.
8. Freepik
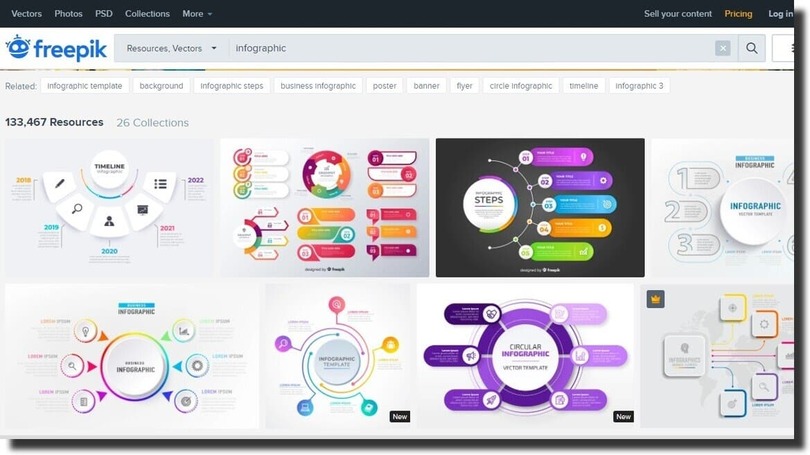
Freepik provides you with thousands of vector images to choose from and edit. The infographic creation tool has both free and premium features to use.
From the available templates, you’re free to use a design that works for you. It also allows you to customize it to meet your brand’s theme. Premium members can download illustrations for free.
In addition, the premium plan gives you a full license to use the designs for personal and commercial purposes without having to acknowledge the original designer.
Freepik gives you multiple formats for your infographics, including PSD illustrations. Premium users have the advantage of downloading 100 designs in a day, unlike free users who are limited to 10.
9. Mind the Graph
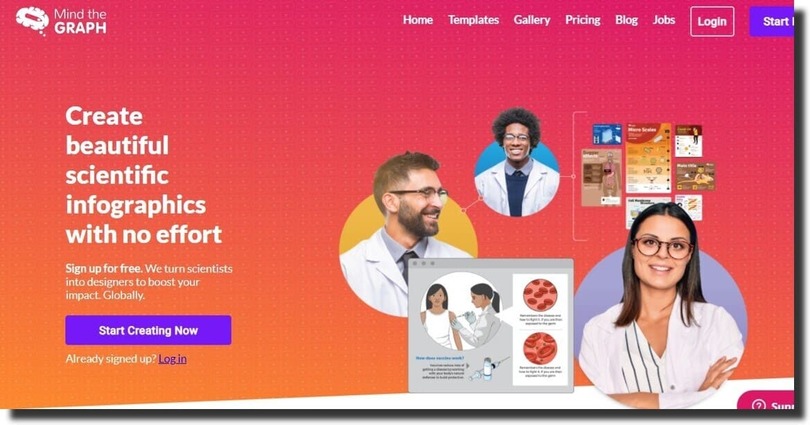
Mind the Graph allows you to sign up for free to create scientific infographics from research. The tool gives you over 200 templates to choose from and more than 80 presentation slides.
With the drag & drop feature, it’s easier for anyone with no design skills to use the tool. The pricing ranges from beginner, which is free to use, junior, senior, and ProTeams.
The infographic creation tool is suitable for beginners to professionals, individuals to groups, and small labs to large organizations.
The templates are available in various sizes. The art gallery has over 40,000 illustrations for scientific designs.
10. PicMonkey
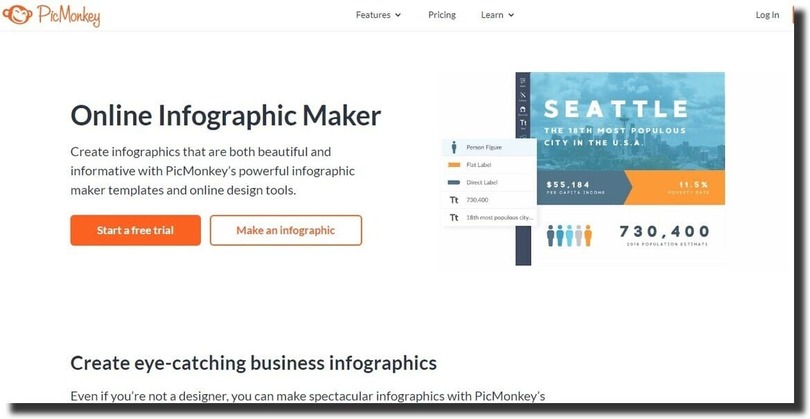
PicMonkey is an infographic creation tool that offers a free trial period for first-time users. It is easy to use for beginners and does not require a learning curve.
To create an infographic, begin by selecting a template, then customize it according to your brand. Once you’re content with the edits, export the design for marketing.
Besides using templates, PicMonkey also allows you to design an infographic from scratch. The tool has five types of infographic styles. These are – tips list, ordered steps, statistics, timeline, and comparison charts.
Besides the 7 days trial, PicMonkey offers basic, pro, and business pricing plans. Some of the premium features are Touch up and Image storage. The tool also has integrated cloud storage to allow users to edit and use infographics from anywhere.
11. Snappa
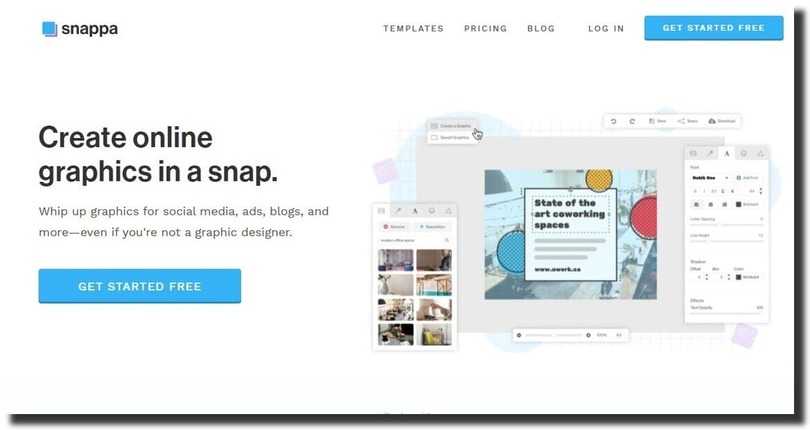
Snappa is an online tool that allows users to create designs for social media, blogs, ads, and infographics. The infographic creation tool has a variety of templates for designers to use.
With over 5 million stock photos, you do not have to worry about images to use for your design. They are free to use. Are you worried that you do not have design skills?
Snappa presents you with over 200 fonts and more than 100,000 shapes and vectors to help you design an appealing visual. Besides, if you do not find the background interesting, you can remove it with the online tool.
You can also resize your graphics and share them on your preferred platforms. Besides, you can connect Buffer to schedule and publish posts from the tool.
12. Befunky
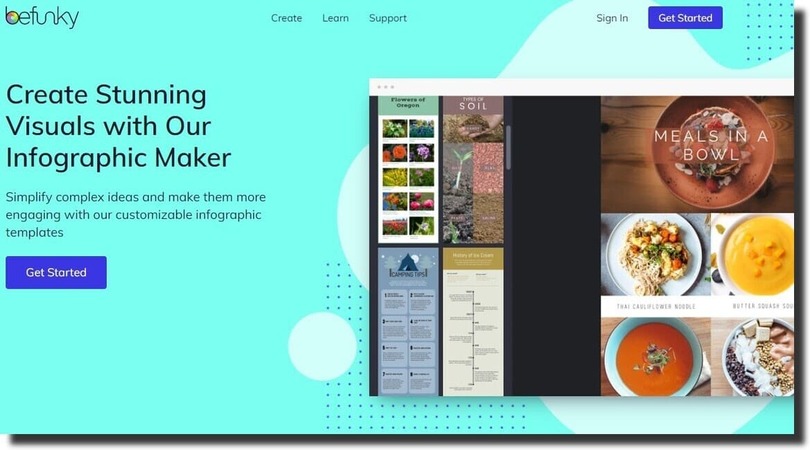
Befunky is an online tool that helps designers create visuals, edit photos and make a collage. It allows you to test your creativity by designing visuals from scratch.
However, for non-designers, it has templates to use and a drag & drop feature for convenience. A Befunky graphic designer tool is easy to use.
Are you looking for a tool to help you achieve a vintage or classic design? The designer tool has a variety of features to use. The elements are quick and easy to access. Befunky has millions of images from pexels, Unsplash and Pixabay.
13. Infograpify
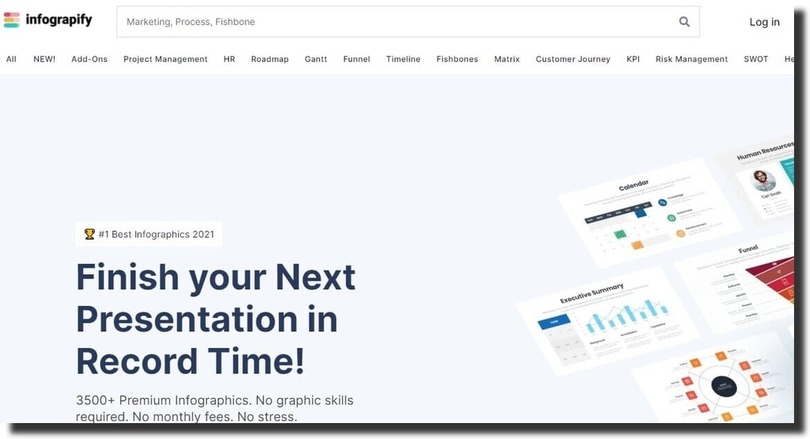
Infograpify has a library of templates and slides for designers to make stunning visuals. It has over 80 visuals that are easy to customize.
Infograpify has two pricing plans. A full access pass and team access. Examples of visuals to design are timeline, roadmap, project management, Gantt chart, and dashboard infographics.
The Infograpify slide integrates with Keynote, Powerpoint, and Google slides. In addition, it gives you access to Photoshop and Illustrator formats.
Infograpify makes it easy to link to Excel and download your work into your computer for use.
14. Animaker
Animaker, as the name suggests, is a tool that helps you create animated videos to use with infographics. Do you have complex ideas that you want to simplify to increase engagement?
Animaker makes it easy for you. As a marketer, the tool makes it easy to create engaging videos for your target audience. Select from over 1000 templates and design your animations within five minutes.
For a beginner, it is not as easy coming up with an animated video. It can be time-consuming as you need time to understand how the tool works.
Animaker is both free and premium to use. The premium plan has a starter, basic, pro, and enterprise pricing.
15. Lucidpress
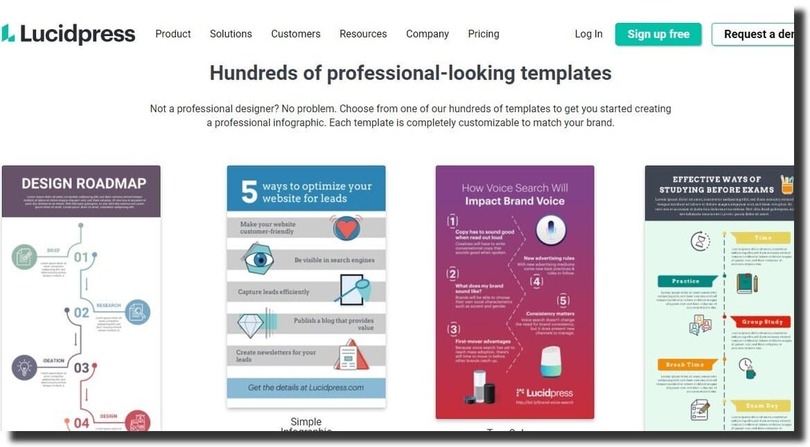
Lucidpress is a cloud-based infographic tool. You can edit or access infographics from anywhere. It has a drag & drop feature to help you create beautiful infographics.
With hundreds of templates, you can select one that appeals most to you. The templates are also customizable to fit your brand’s theme.
Ludipress allows you to share your designs using a multi-channel distribution list. That is, you can choose to print the infographics, share them on email or publish them on social platforms.
The infographic creation tool allows you to collaborate with team members and share controls. Lucidpress helps you create consistent designs that are specific to your brand. As for pricing, it has free, pro, team, and business profiles.
Are Infographics Still Relevant?
Infographics are still relevant to use. Infographics make it easy to communicate complex information to the target audience. Most people prefer using infographics instead of reading long texts to identify important information.
With the tools above, you can create engaging, high-quality infographic videos. If you’re on a tight budget, you may consider creating visuals on a free infographic creation website. Besides, these tools help you monitor the performance of your infographics.
If you’re not using infographics, you’re missing out on a potential marketing strategy. It helps you increase brand awareness and boost SEO rankings on search engines.
As a form of marketing, you can publish infographics on social platforms like Facebook and Instagram. Therefore, if you’re looking for ways to create engaging content, consider using video or text-based infographics.

